

July 18, 2022
While today’s headline CPI number is painfully high at 9.1%*. We want to point out this is a lagging indicator.
“The Consumer Price Index (CPI), which measures changes in the inflation rate, is another closely watched lagging indicator. Few events cause more economic ripple effects than price increases. Both the overall number and prices in key industries like fuel or medical costs are of interest.” Investopedia
Let us look at one of the pieces of data which we monitor, as it is an indicator of the future trend.
“The ISM manufacturing index is a composite index that gives equal weighting to new orders, production, employment, supplier deliveries, and inventories. Each factor is seasonally adjusted. The ISM Report on Business contains three separate purchasing managers indexes based on surveys.” Investopedia
“The ISM PMI index is considered to be a leading indicator. It helps foretell future spending and expenditures that contribute to economic expansion. The indicator tends to reflect changes before the economy does.” Forex Training Group
So, let’s look at the ISM Manufacturing Report on New Orders and the ISM Manufacturing Report on Inventories.
Please see the chart below, which is the ISM Manufacturing Report on New Orders (green line), and the ISM Manufacturing Report on Inventories (orange line). The new orders (the green line) have gone down, and (the orange -line) inventories have gone up. Inventories are building while new orders are going down, does this sound like an inflationary scenario or deflationary scenario? Well, it is not inflationary! A classic inflation example is, “too much money chasing too few goods”. What we are seeing here portends deflation.
Let us look at the bottom graph, which simply shows New Orders minus Inventory. On the bottom graph, the ratio is shown as either green which is a positive ratio, or red which is a negative ratio. You can see the red negative triangle. It is negative 6.80 or (-6.80). The last time we saw red was at the beginning of the pandemic in 2020. The time before that was back in 2012; more on this in our next One-page: Once-piece of the Puzzle. If the negative trend continues, no doubt we will have deflation.
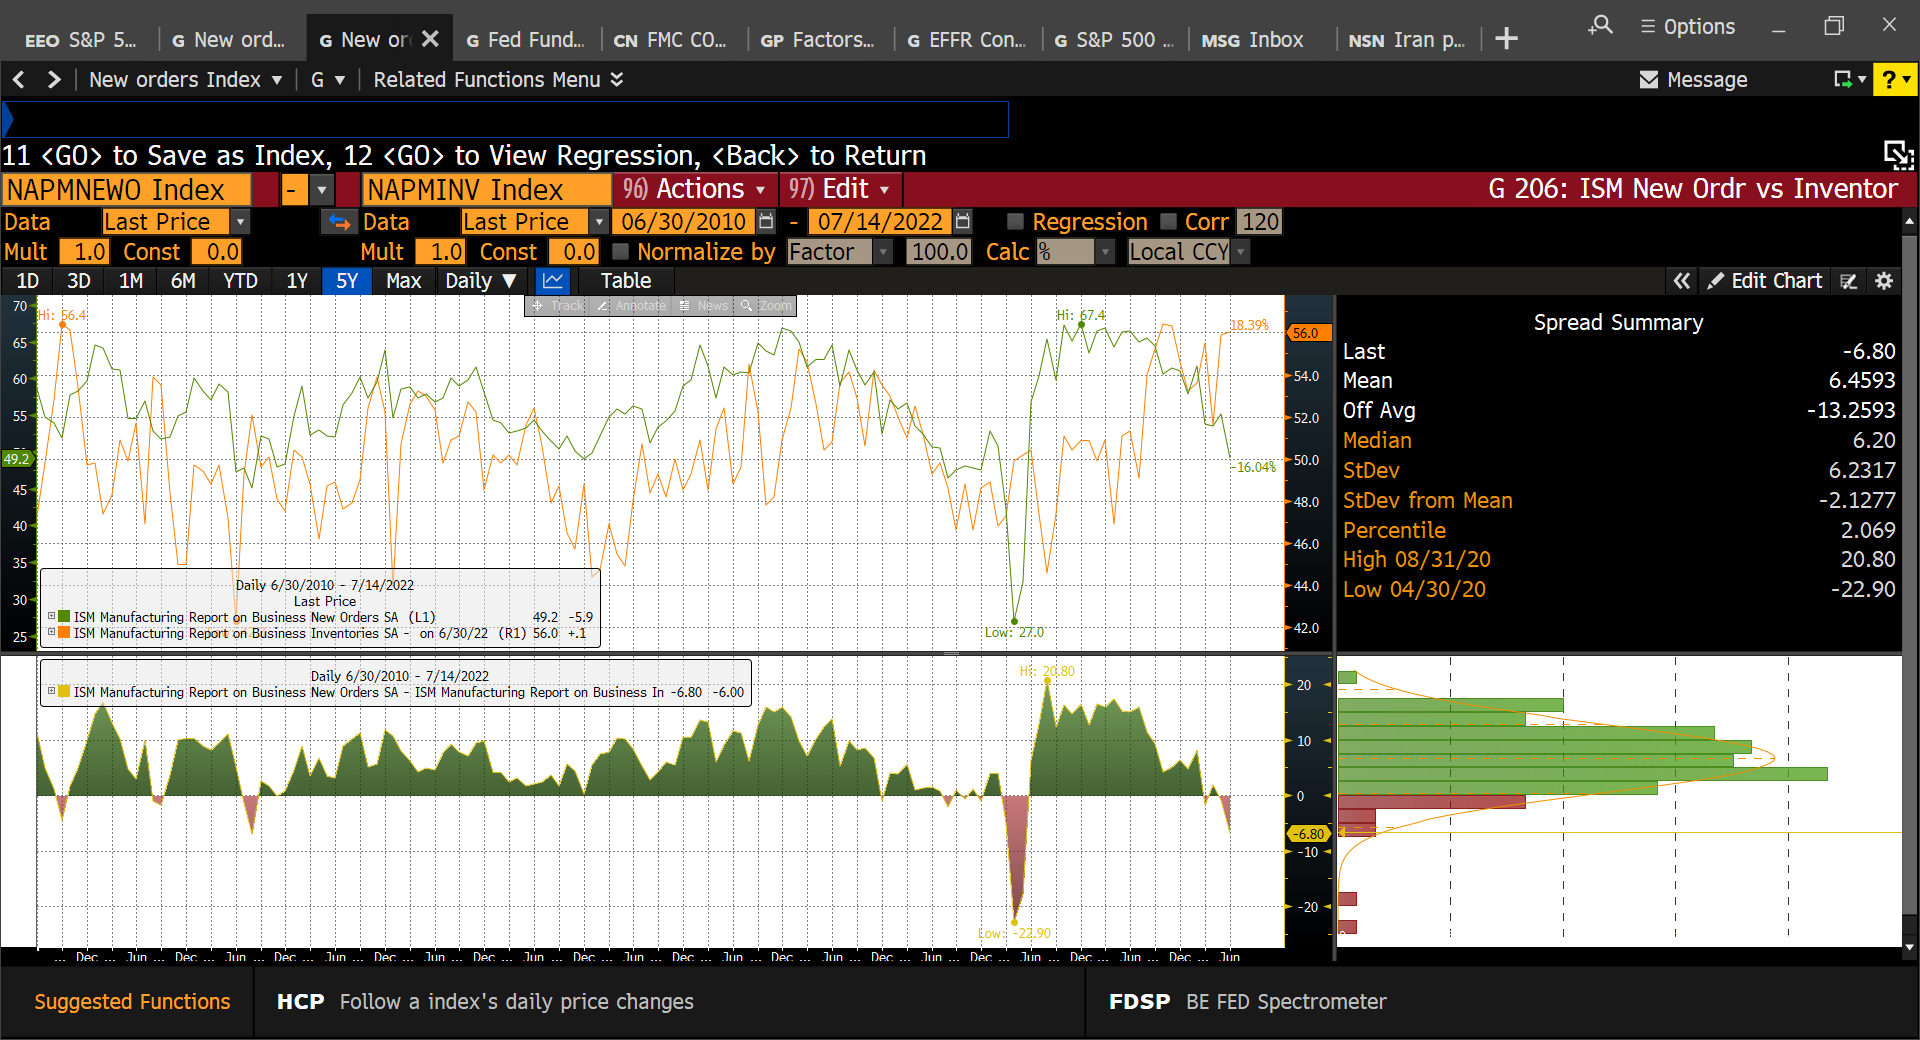
Chart data source Bloomberg. Created by Jonathan V. Bever
DISCLOSURE:
*all items index before seasonal adjustment ended June 2022, U.S. Bureau of Labor Statistics. https://www.bls.gov/news.release/cpi.nr0.htm
Investment advisor representative of and securities and investment advisory services offered through Cetera Advisor Networks LLC, member FINRA/SIPC, a broker/dealer, and Registered Investment Advisor. Cetera is under separate ownership from any other named entity. In addition, some Investment advisory services are offered through Fulcrum Wealth Advisors, LLC. Fulcrum Wealth Advisors, LLC is a registered investment advisor in the State of Washington.
Branch Address: 10940 NE 33rd PL., #210 Bellevue, WA 98004 Branch Phone: 877-400-0260
The views stated in this letter are not necessarily the opinion of Cetera Advisor Networks LLC and should not be construed directly or indirectly as an offer to buy or sell any securities mentioned herein. Due to volatility within the markets mentioned, opinions are subject to change with or without notice. Information is based on sources believed to be reliable; however, their accuracy or completeness cannot be guaranteed. Past performance does not guarantee future results. Investors cannot invest directly in indexes. The performance of any index is not indicative of the performance of any investment and does not consider the effects of inflation and the fees and expenses associated with investing.