
Table of Contents

February 13, 2025
“I hope this recession doesn’t last much longer; they are working me to death!” — Quote from a bricklayer in 1969.
Imagine retiring into a world where rising inflation eats away at your savings and market volatility leaves you uncertain about your financial future. Today’s retirees face a similar environment to the 1960s-1970s when inflation surged and monetary policies shook the markets.
Ernest Hemingway famously wrote in The Sun Also Rises:
“How did you go bankrupt? Two ways. Gradually, then suddenly.”
This quote perfectly captures the dangers of ignoring early warning signs in financial planning, particularly regarding inflation.
Summary
This blog examines the economic parallels between the 1960s-1970s and today to help retirees and near-retirees make informed investment decisions. It reflects on how inflation, monetary policy, and market conditions shaped financial outcomes during that era and uses those lessons to guide modern strategies.
With an outlook for 2025, the focus is on building resilient investment portfolios to navigate inflationary pressures and market volatility.
Connecting History to Today’s Market
The economic challenges of the 1960s-1970s are echoed in today's financial landscape. Persistent inflation, fueled by pandemic-era stimulus and supply chain disruptions, has prompted the Federal Reserve to adopt a more aggressive stance. While the tools and circumstances have changed, the lessons remain relevant. As our economy slowed after the Feds’ aggressive rate hikes, the Fed pivoted toward a more stimulating policy. Nonetheless, the ten-year treasury yield has gone up indicating that the cost of capital will continue to be higher for longer.
What This Means for Retirees:
Building a resilient portfolio that can withstand both inflationary and deflationary pressures is essential. Flexibility and proactive management will be critical to achieving your financial goals.
What’s Interesting:
The comparison between the 1960s—1970s—a time of economic growth followed by the upheaval of recessions—and today offers a compelling perspective. Readers gain insights into how historical challenges like inflation and Federal Reserve rate hikes impacted investments, providing a relatable backdrop for understanding current economic trends. The blog also highlights actionable strategies for navigating today’s uncertainties, ensuring relevance for retirees managing their portfolios.
The 1960s and 1970s were a special era in US history. We had the invention of hippies, a counterculture movement, and a baby boom—further, the famous abandonment of the Gold Standard under Richard Nixon in 1971. The demographics and economic policy led to a strong GDP and persistent inflation.
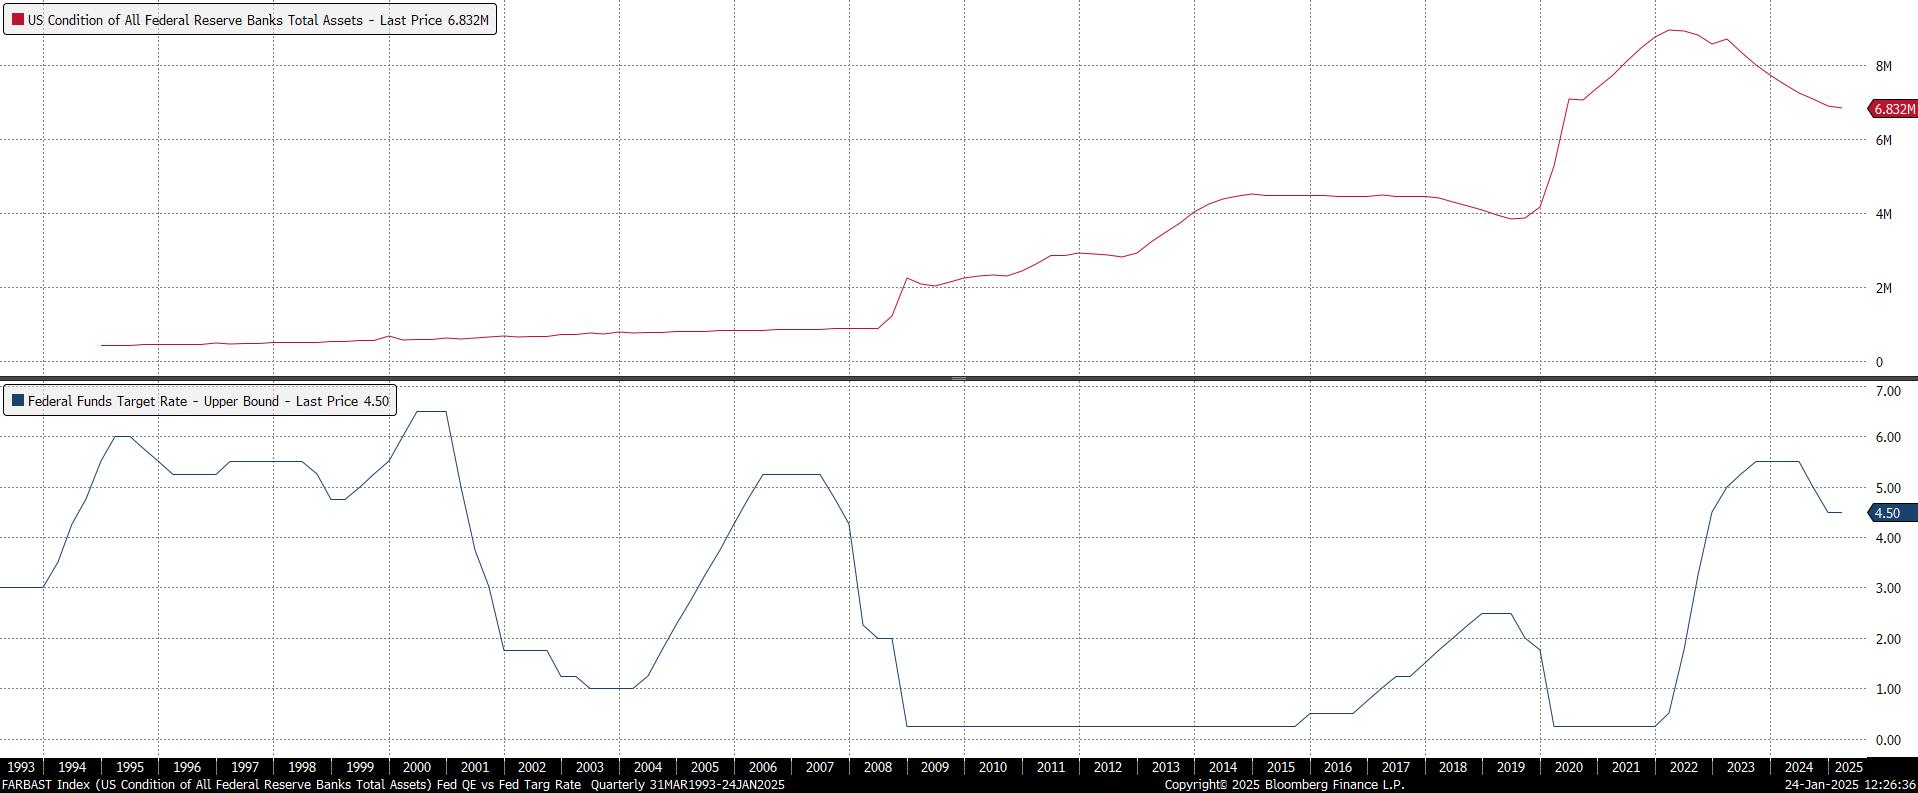
Today, however, we don’t have a baby boom, rather we have artificial replacements to fight disinflation and deflation which follows a low birth rate. We have Artificial Intelligence or AI, and an economic stimulus called Quantitative Easing, or QE. QE is the modern economic drug of choice. You can see from the chart below the Fed balance sheet in 2008 was under one trillion. During the pandemic its balance sheet reached over nine trillion. Please see the chart:
(Data by Bloomberg. Chart created by Jonathan V. Bever)
In 2022 robust inflation came along and stifled the benefits of QE, so there was a pivot called Quantitative Tightening (QT) (reduction of its balance sheet). It has been reduced to 6.8 trillion which is far from the 1 trillion in 2008.
We believe robust inflation will be hard on the trail of too much monetary stimulus. We address this in our blog:
Inflationary Gap Getting the Genie Back in the Economic Bottle: Resetting GDP
Accurate Forecasting
Last year, we argued for around a 12 percent return with the caveat that if the Fed cuts rates, our forecast would be far too low. 2024 Market Outlook: Navigating the Bull's Return. The S&P 500 hit our price target in the first half of the year. The Fed cut rates in the second half, and the S&P rallied to perform far above our forecast, as we expected.
Outlook for 2025: Navigating the Road Ahead
Looking forward, 2025 is likely to be a year of both opportunities and challenges. While lower borrowing costs and corporate share buybacks could support modest growth, persistent inflation poses risks.
Our Forecast: A 12% annual return for the S&P 500 under favorable conditions. However, if inflation remains stubbornly high, the Federal Reserve may take a more hawkish stance, leading to flat or negative market performance.
Bifurcated Prosperity
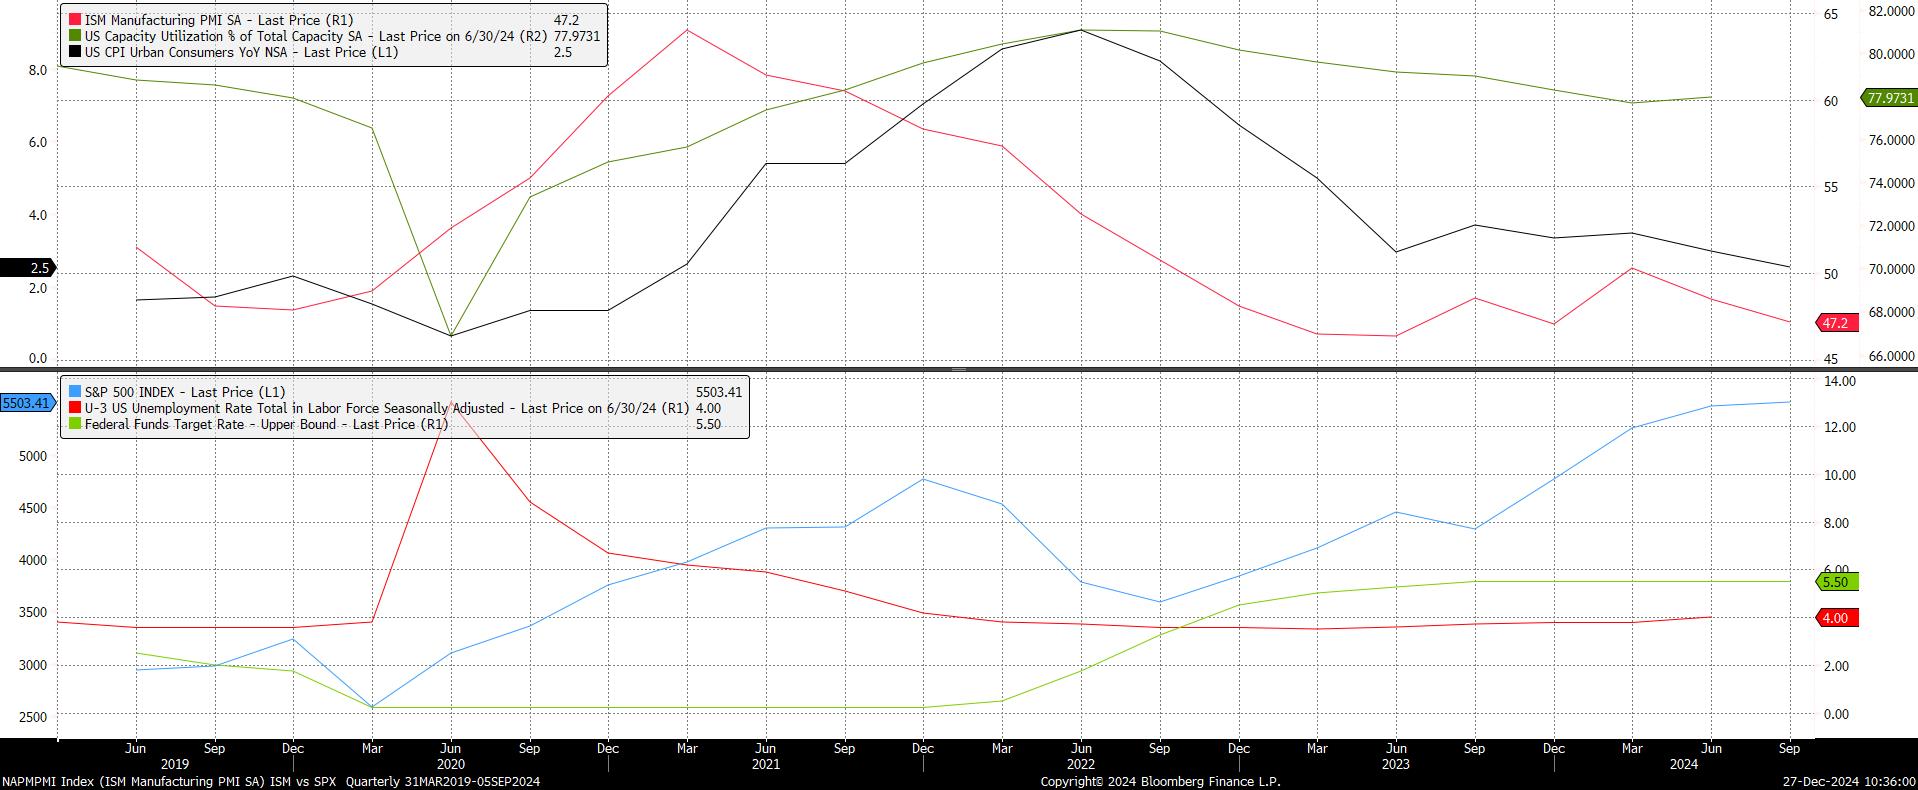
The 60s and 70s had a strong GDP and the economic benefits had wide participation. In contrast today, the sharing in economic growth and prosperity seems to be more bifurcated as well as the effects of inflation. We are sure you can think of your examples. One example we will highlight is the Manufacturing ISM. The US has not entered an official recession (at least not yet) since the Fed began its aggressive rate hike cycle in 2022, the ISM Manufacturing Index has been contracting for the most part since November of 2022. Under 50 is indicative of a contraction. Over 50 is expansion. Please see the top red line on the chart:
(Data by Bloomberg. Chart created by Jonathan V. Bever)
Inspiration
Once again, while writing this blog, I found myself writing a new blog from my favorite coffee shop in Shibuya. In Japan, I also visit Nison Crossing in the Ginza district. Often on display is their current concept car which is not yet available. This year, however, they chose to display a couple of classic vintage cars rather than vehicles in the future. One car from 1968 and one from the 1970s and a few articles of clothing representing the same era; reminding us that history does have cycles which resemble times gone by. The display cars are not for sale of course; however, I was disappointed to find the clothes were not for sale either. Nonetheless, I was elated and took this as a good sign we are on the right path. We hope you will enjoy the three vintage pictures.

(Photo by Jonathan V. Bever: Nissan (Datsun) 1971)
What could disrupt our forecast would be any unforeseen inflationary event causing the Fed to shift its easing policy to a restrictive policy. This would bring uncertainty and a lower return with risk assets. We hope for peace and the continuation of a Goldilocks environment for our economy.

(Photo by Jonathan V. Bever: Vintage Clothing Japan 1960-1970)
Returning to the 60s70s
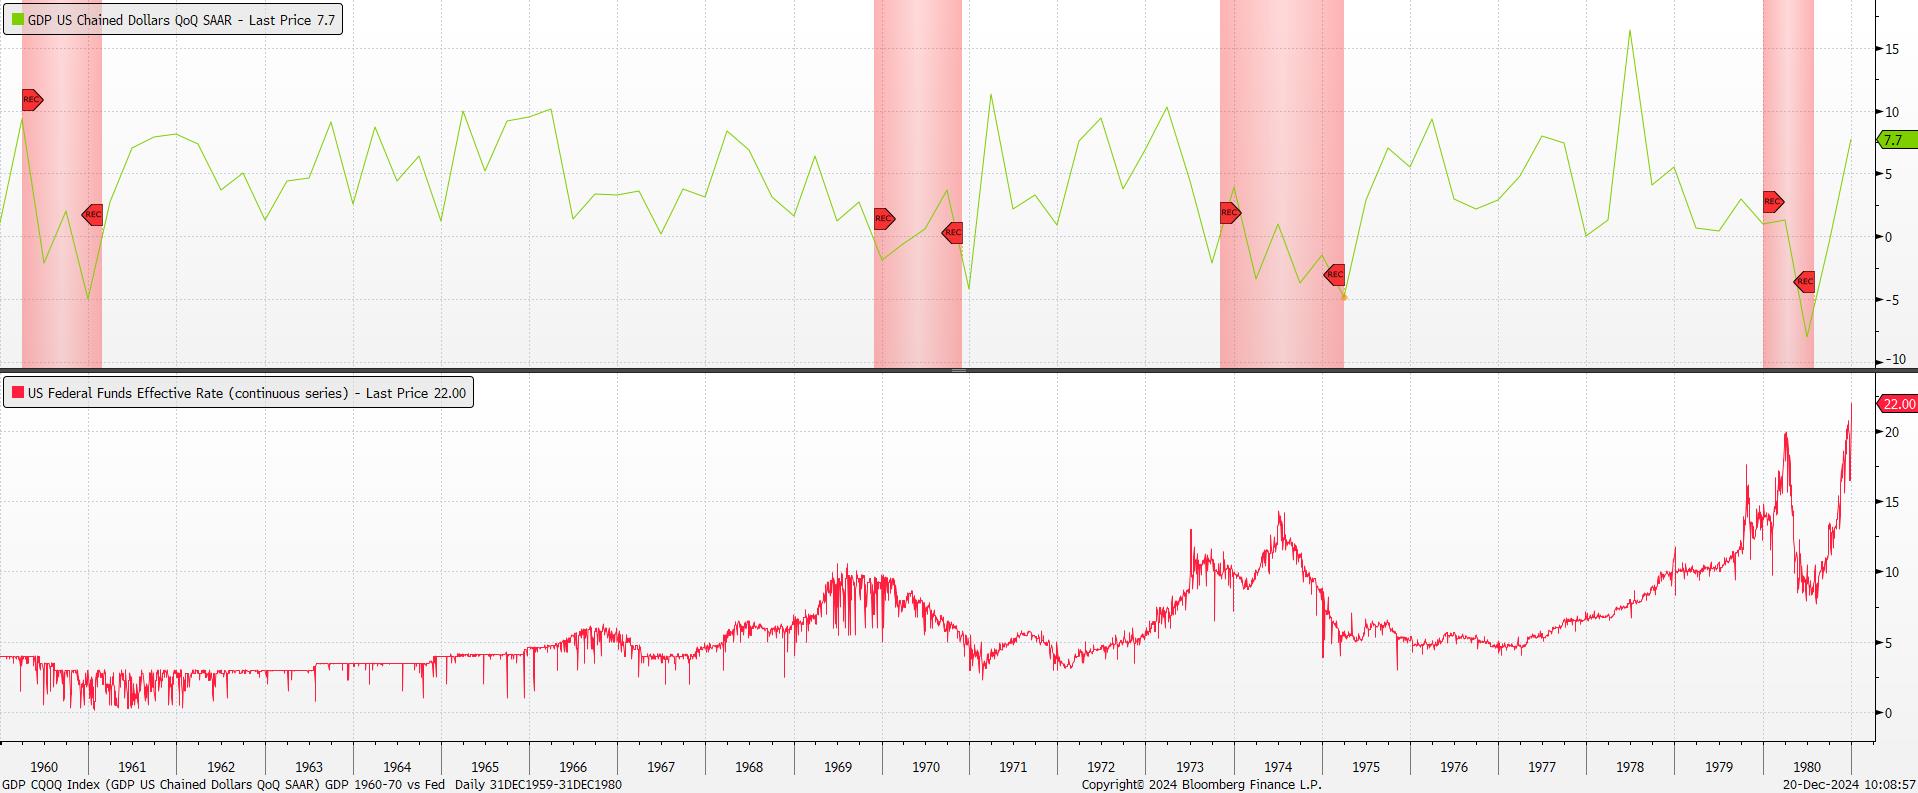
In the years ahead, however, we believe inflation will continue to be a problem for the Fed. We believe "higher for longer" interest rates will be the norm. This is reminiscent of the 1960s-1970s. During that period the strong economy was met with various recessions as the Fed and monetary policy fought inflation by raising rates. There were 4 recessions during that period: every 5 years. 1960 was the first recession and the last recession was in 1979. The Fed would raise rates to fight inflation. A recession would follow. The Fed would lower rates and the economy would recover, and inflation issues followed. Inflation in the 1960's was tame compared to the 1970's as measured by the CPI. In the 1970s we abandoned the gold standard, and the inflation which ensued made the 1960s look like a beach party. Inflation was in a tug of war with economic stimulus and recession. Who would ultimately win: the famous Fed Governor Volcker, that’s who! At the end of 1979, the Fed rate was around 10% and one year later, by the end of 1980, Volcker took it to almost 20%. In sum: the Fed rate in 1960 began around 3.84% and twenty years later was around 10%. One year later it was about 20%. Just let that sink in.
Please see the chart below showing GDP on top with the recessions, and the Fed target rate in red at the bottom:
(Data by Bloomberg. Chart created by Jonathan V. Bever)
Index Returns of the 1960’s-1970’s
Let’s look at the stock market performance to see if you can keep up with inflation by passively investing in a popular index. Today passive investing is extremely popular, so taking a longer-term perspective is prudent. The Dow Jones closed at 679.35 on 12/31/1959. 12/31/1979 closed at 838.74. Bloomberg Total Return Analysis shows a total return of 23.4621% for an annual return of 1.0587%. However, if you reinvested the dividend in the Index the total return is 149.8345% or 4.6816% annually. Interesting to note, that what you do with dividends is essential to long-term returns.
Please see the chart:

(Data by Bloomberg. Chart created by Jonathan V. Bever)
Now let’s look at the S&P 500.
SPX 500 closed on 12/31/1959 at 59.89. SPX 500 closed on 12/31/2079 107.94. The Total Return Analysis from Bloomberg shows a total return of 80.2304% and an annualized return of 2.9871%. Again, if the dividends are reinvested, then the total return increases to 275.5379% and an annual return of 6.8349%
Please see the chart:
(Data by Bloomberg. Chart created by Jonathan V. Bever)
Goldman Sachs recently forecasted a 3% return for the S&P 500 for the next ten years, which is not far from the 1960’s- 1970s’ return of 2.98%. Coincidence?
Consumer Price Index. CPI
Now let’s look at inflation as measured by the CPI for the same period. The Bloomberg Total Return Analysis shows the CPI had a total return of 161.4757% or 4.9198% per annum.
Keeping up with inflation as a passive investor would have been a challenge. We think this will be true for the next 10 years as well.
The CPI during the 1970s per The Bloomberg Total Return Analysis was 103.9788% and per annum 7.3845%. In contrast, 1960 was 28.1877 and 2.5123% per annum. In August 1971, Nixon took us off the gold standard. We think this illustrates inflation as a form of monetary policy.

(Data by Bloomberg. Chart created by Jonathan V. Bever)
Lessons from the 1960s-1970s: Inflation’s Impact on Investments
The 1960s- 1970s were a defining period for the U.S. economy. Inflation surged after the U.S. abandoned the gold standard in 1971, leading to higher prices and reduced purchasing power. The Federal Reserve responded with aggressive interest rate hikes, culminating in rates of nearly 20% by 1980. These measures curbed inflation but came at the cost of economic stagnation and market volatility.
Investment Challenges:
The Dow Jones Industrial Average delivered an annualized return of just 1.06% without reinvested dividends.
The S&P 500’s performance improved with reinvested dividends but still underscored the difficulty of maintaining real wealth.
Today’s Investment Realities:
Inflation threatens the purchasing power of retirees’ fixed incomes.
Market returns may be subdued, with projections for the S&P 500 averaging just 3% annually over the next decade.
Two Modern Economic Theories:
It seems that we have two prevailing views of economic theories which people cling to today. The ideals oppose each other and are constantly debated with passion: not unlike the two main political parties, held with deep passion, conviction, and almost religiously defended.
The two different financial economic thoughts we refer to are: the Modern Monetary Theory MMT), and the Austrian Economic Theory. MMT is a modern-day version of Keynesian economics. Keynesian economics believes printing money to stimulate the economy when needed is a good idea, and when the economy recovers the additional money printing should be shelved or reduced. MMT seems to ignore the idea that there should be a limit to money printing and economic stimulus. They print money in good times and more money in bad times. A gold standard does not fit this economic theory.
“Modern Monetary Theory is a macroeconomic model positing that countries that issue their currencies, such as the U.S., are not constrained in their spending. Proponents of MMT argue that such countries can't default on the securities they issue, as they can simply print or issue more currency.” Investopedia
Austrian Economic Theory
The other predominant economic view in our opinion, is the Austrian Economic Theory, which some believe is dead as we no longer have a gold standard. This view of economics prefers a gold standard and is far more conservative regarding economic stimulus and deficits. They want a balanced budget and see too much debt as inhibiting economic growth. Further, it might be tempting to print even more money in a recession, leading to excessive money printing. This could have adverse consequences such as hyperinflation, a deep recession, or depression, as seen in the history of The Weimar Republic.
“Hyperinflation affected the German Papiermark, the currency of the Weimar Republic, between 1921 and 1923, primarily in 1923. The German currency had seen significant inflation during the First World War due to how the German government funded its war effort through borrowing, with debts of 156 billion marks by 1918. This national debt was substantially increased by 50 billion marks of reparations payable in cash and in-kind (e.g., with coal and timber) under the May 1921 London Schedule of Payments agreed after the Versailles treaty.” Wikipedia, the free encyclopedia
Austrian Economists might see recessions as the lesser of evils as they reduce excesses. Of course, avoiding a recession and boom and bust cycles is the best strategy. Printing money and rescuing failing businesses is not the true spirit of capitalism and has adverse consequences.
A gold standard limits the amount of credit or lending a bank can do because it must have a certain amount of gold or a ratio of lending to its gold reserve. This can be stifling on the one hand, and a refuge in an economic storm, on the other.
This “Austrian “theory of the trade (or business) cycle, which has its roots in the works of Wicksell and Bohn-Bawerk, claimed that the origin of recessions lay in the interference of monetary authorities in the setting of interest rates. During upturns, credit created with the help of central bank liquidity would fuel investment demand beyond society’s long-term willingness to save, thus generating a mismatch between the economy's productive capacity and consumer’ intertemporal spending plans. Recession would hit when the strains inherent in this mismatch became apparent, and the economic activity would not recover until past investment “mistakes “had been corrected.
IMF Working Paper: Stefan Erik Oppers. https://www.imf.org/external/pubs/ft/wp/2002/wp0202.pdf
As you can see these two views are in direct opposition to the other. When MMT is taken to an extreme, the possibility of economic stifling inflation increases. If this happens then a policy shift of economic tightening follows. A restrictive economic policy tends to be more like having a gold standard. On the other hand, after too much tightening the consequences can be severe as well such as disinflation, deflation, and recession. We wrote about our theory of an economic cyclone index in our last blog. When the metaphoric Fed needle moves swiftly, in either direction, from a loose economic policy to a tight economic policy it can be painful and destructive like a cyclone.
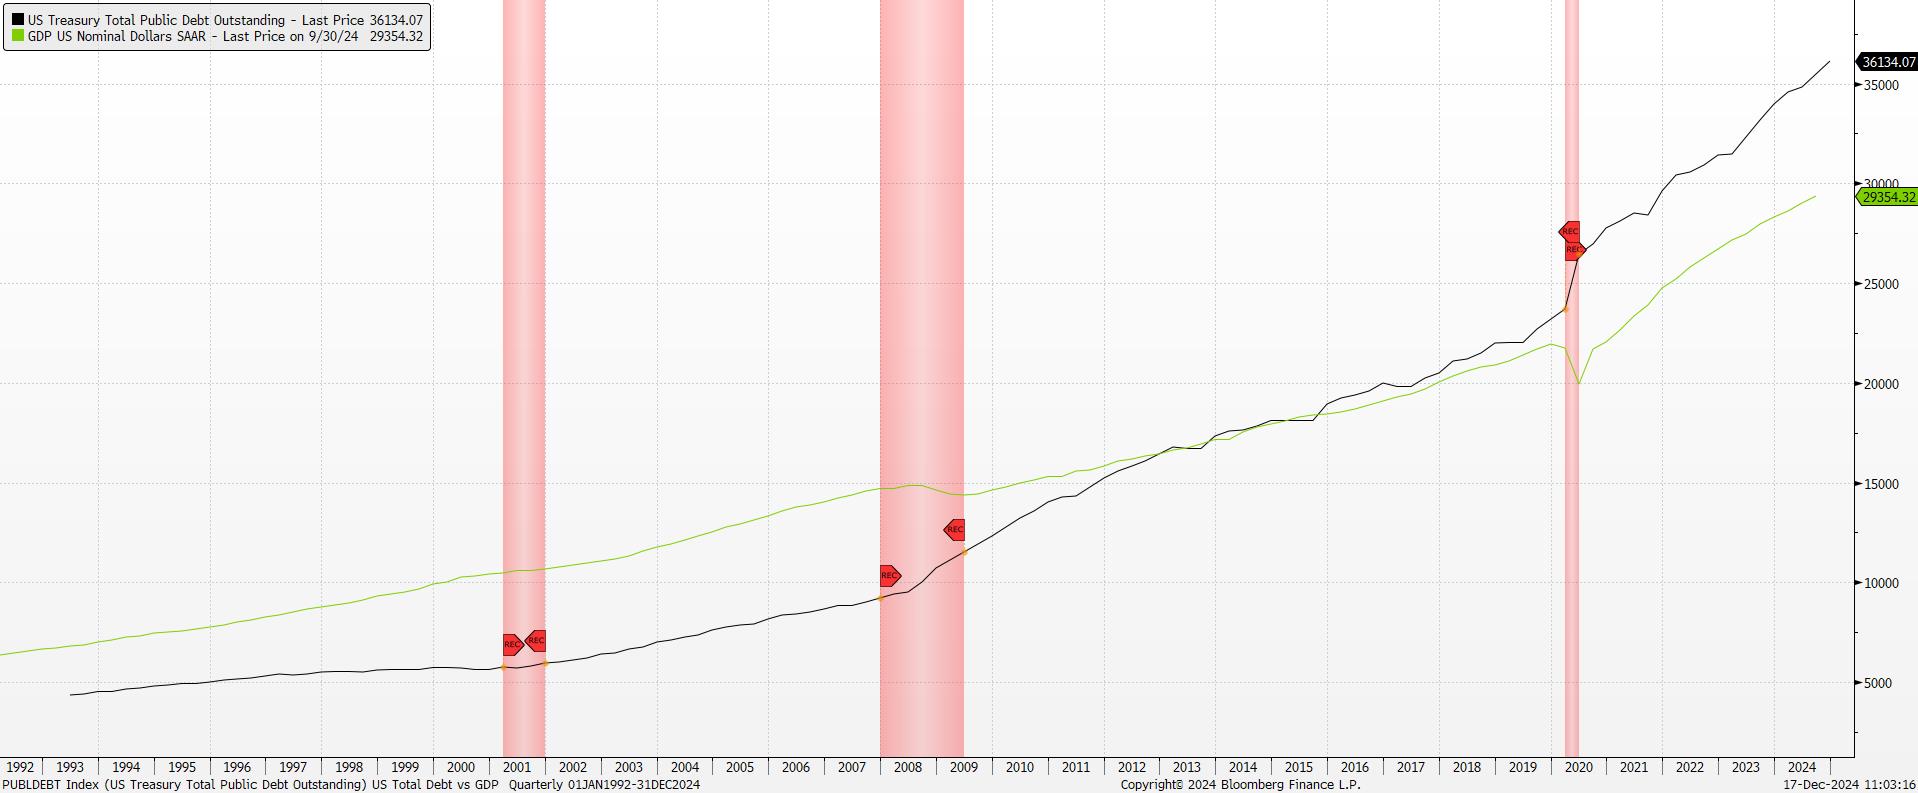
While there are periods of the Fed raising rates and reducing its balance sheet called Quantitative Tightening (QT) for the most part it has been an MMT economy. Economic policy has erred on the side of stimulus with ever increasing deficits, low interest rates at the Fed, and QE readily available when needed. When policy has moved toward tightening by raising rates implementing QT, then what followed have been mini economic cyclones. Then the pivot and back to a stimulative policy. Therefore, the overarching economic theory being implemented has been MMT. It seems regardless of what has been said, the MMT believers have been in charge since the Great Financial Crisis, which can be seen by the amount of the national deficit. Currently, the public debt is over 36 trillion, growing by a lot every year. Currently, our GDP is slightly over 29 trillion giving us debt to GDP ratio of 1.20 as illustrated in the following charts:
(Data by Bloomberg. Chart created by Jonathan V. Bever)
What keeps us up at night? During the Great Financial Crisis, our GDP was greater than the total public debt. Should this raise an eyebrow? Should we be concerned an Austrian Economist fear will play out: deep recession, hyperinflation, or great depression?

(Data by Bloomberg. Chart created by Jonathan V. Bever)
Are we on the cusp of the Fed having to cut rates a lot to fight deflation? Will the Fed have to pivot and talk about raising rates to fight deflation? If the Fed policy pivots and moves quickly in either direction, then we can experience an economic cyclone and massive market volatility. Should the US adopt a conservative economic policy such as the Austrian economic policy, or will debt levels and ratios be ignored allowing MMT to continue ad infinitum? Ad infinitum or to infinity. The two economic policies seem to be a dualistic manifestation of economic policy. Whichever way the new administration leans, we hope balance can be achieved for optimum economic growth.

(Photo by Jonathan V. Bever: Datson 1968)
Inflation
Currently, the inflation we have experienced these past few years has been largely caused by huge amounts of money printing, increasing the large US deficit. Inflation being sticky should be no surprise. The risks of large deficits are not lost on us. Some think the entitlement obligations, such as social security, pensions, etc. will hamstring economic growth and ultimately the returns on investments. This sticky inflation is why we are concerned about the Fed's ability to manage its dual mandate: keep inflation in check and have full employment. It seems everyone remembers Paul Volker, a hero taking the gloves off to fight inflation by taking the Fed target rate to 20. Yes, 20, and the price-to-earnings ratio on the S&P at that time was 8. Today our S&P P/E is 25.
Inverted Yield Curve
Before this period the Fed's main tool was to lower and raise their interest rate. It was a fulcrum to either stimulate or slow the economy. Raising rates puts a break on the economy by making the cost of money more expensive. If it raised rates enough and its rate was equal to or above the ten-year US Treasury this was bad news for the economy; this condition is called an inverted yield curve. An inverted curve is a harbinger of a recession. So, the longer the inversion the higher the probability of a recession. Why risk a recession and the loss of jobs? To fight inflation, of course. This was the tug of war in the 1960s and got more exacerbated in the 1970s which ultimately led to the Fed Gov Volcker who raised the Fed rate to 20 percent in 1980. We will continue to focus on the data as it reveals itself. We will have more updates and visits to the Nisson Crossing; hopefully, the concept car of the future on my next visit is not a horse and buggy.
Investors might be tempted to reach for yield in their fixed-income strategy by increasing duration or lowering their credit quality, and we advise being very cautious in doing so. Likewise, an investor may be tempted to hide out in passive index investments, but the risk here may not be just limited to underperforming inflation. We like short duration high credit quality fixed income, and stocks with solid fundaments going forward along with a more tactical strategy.
Strategies for Investment Planning in 2025
Investing during retirement involves balancing growth with preservation. Here are actionable strategies to consider:
Diversify for Inflation Protection
Prioritize Quality Investments: High-quality stocks can help with income from a dividend and the potential for price appreciation.
Adjust Fixed Income Allocations: Rising interest rates can hurt long-term bonds. Focus on shorter-duration, high-credit quality bonds for less volatility.
Stay Flexible: Consider a more tactical approach that allows for more nimble portfolio adjustments based on economic conditions and market trends.
Conclusion: Investing with Confidence in Uncertain Times
The lessons of the past remind us that economic challenges are not new, but they demand thoughtful planning and execution. By diversifying your investments, prioritizing quality, and staying flexible, you can navigate the uncertainties of today’s market and help prepare for a secure financial future.
Definitions:
Some of the earliest “hippies” were university students living in California’s Bay area. Many lived in an area of San Francisco called Haight-Ashbury, which became famous as one of the main areas for people looking to live the hippie lifestyle.” Interexchange.org
The Dow Jones Industrial Average (DJIA) is a stock market index that tracks 30 large, publicly owned blue-chip companies trading on the New York Stock Exchange (NYSE) and Nasdaq. The Dow Jones is named after Charles Dow, who created the index in 1896 with his business partner, Edward Jones. Also referred to as the Dow 30, the index is considered a gauge of the broader U.S. economy. Investopedia
S&P 500, or simply the S&P, is a stock market index that measures the stock performance of 500 large companies listed on stock exchanges in the United States. It is one of the most commonly followed equity indices, and many consider it to be one of the best representations of the U.S. stock market. - Wikipedia
The Federal Fund Rate:
The federal funds rate is the target interest rate range set by the Federal Open Market Committee. This is the rate at which commercial banks borrow and lend their excess reserves to each other overnight. The FOMC sets the target federal funds rate eight times a year based on prevailing economic conditions. Investopedia
Modern monetary theory or modern money theory (MMT) is a heterodox[1] macroeconomic theory that describes currency as a public monopoly and unemployment as evidence that a currency monopolist is overly restricting the supply of the financial assets needed to pay taxes and satisfy savings desires.[non-primary source needed] According to MMT, governments do not need to worry about accumulating debt since they can pay interest by printing money. MMT argues that the primary risk once the economy reaches full employment is inflation, which acts as the only constraint on spending. MMT also argues that inflation can be controlled by increasing taxes on everyone, to reduce the spending capacity of the private sector.[2][3][verification needed][4] – Wikipedia
CPI:
Consumer prices (CPI) are a measure of prices paid by consumers for a market basket of consumer goods and services. The yearly (or monthly) growth rates represent the inflation rate. Bloomberg
The Prime Rate:
The prime rate is the interest rate that commercial banks charge their most creditworthy customers. The Federal Reserve System sets the federal funds overnight rate which serves as the basis for the prime rate, which is the starting point for other interest rates.1 Investopedia
Quantitative easing (QE) is a monetary policy whereby a central bank buys government bonds or other financial assets in order to inject money into the economy to expand economic activity. Wikipedia
PCE deflators (or personal consumption expenditure deflators) track overall price changes for goods and services purchased by consumers. Deflators are calculated by dividing the appropriate nominal series by the corresponding real series and multiplying by 100.
The preferred measure by the Federal Reserve of core inflation in the United States is the change in the core personal consumption expenditures price index (PCE). This index is based on a dynamic consumption basket. ... Prior to that, the inflation outlook was presented in terms of the CPI. Wikipedia
The Fed Balance Sheet
4.1 report, which provides a consolidated statement of the condition of all the Federal Reserve banks, in terms of their assets and liabilities. ... It lists all assets and liabilities, providing a consolidated statement of the condition of all 12 regional Federal Reserve Banks. May 11, 2020 Investopedia
DISCLOSURE:
The views stated in this piece are not necessarily the opinion of Cetera Advisor Networks LLC and should not be construed directly or indirectly as an offer to buy or sell any securities. Due to volatility within the markets, opinions are subject to change without notice. Information is based on sources believed to be reliable; however, their accuracy or completeness cannot be guaranteed. Past performance does not guarantee future results. Investors cannot invest directly in indexes. The performance of any index is not indicative of the performance of any investment and does not consider the effects of inflation and the fees and expenses associated with investing.
Investment advisor representative of securities and investment advisory services offered through Cetera Advisor Networks LLC, member FINRA/SIPC, a broker/dealer, and Registered Investment Advisor. Cetera is under separate ownership from any other named entity. In addition, some Investment advisory services are offered through Fulcrum Wealth Advisors, LLC. Fulcrum Wealth Advisors, LLC is a registered investment advisor in the State of Washington. Branch Address: 10940 NE 33rd PL., #210 Bellevue, WA 98004 Branch Phone: 877-400-0260